
Back to homepage
Basic Gnuplot use / mini Gnuplot tutorial
Introduction
Gnuplot is an open source program
used to plot two or three dimensional graphs.
It can operate in interactive mode, or read commands and data from files.
Here are some basic use examples to get you started.

Type in:
gnuplot

to start the program.
You will be presented with intro screen and interactive command prompt (gnuplot>).
You can type help or this formula to get you started:

gnuplot> plot sin(x)

Another graphical window will be created, with sin(x) plotted.
You can copy that to clipboard etc.


Now try:
gnuplot> plot f(x)=x
                    ^
         function to plot expected


We get error message. For some odd reason, this works:

gnuplot> plot f(x)=x,f(x)

and makes a nice graph in a separate window.
Multiple graphs
Now let's make a nicer, more complicated graph:
gnuplot> plot f(x)=(x*x)/(1-x),f(x)
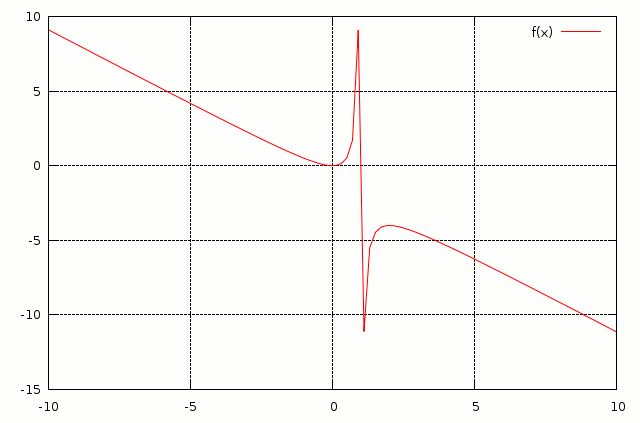
Graph of function f(x)=(x*x)/(1-x).
There can be several functions plotted on the same graph.
Here we plot sin(x) functions with three different periods: one, two and four:

gnuplot> plot f(x)=sin(x*b),b=1,f(x),b=0.5,f(x),b=0.25,f(x)
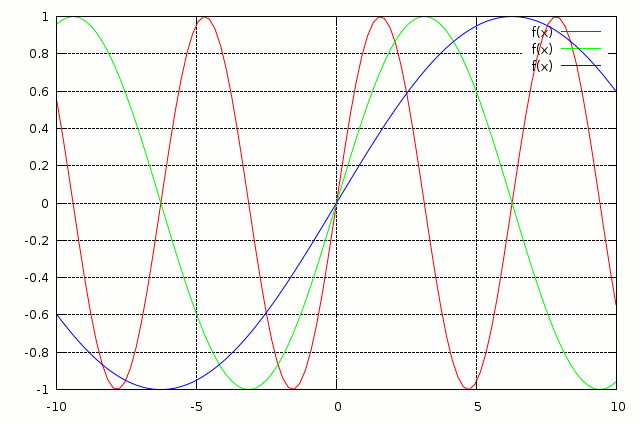
Three sin(x) functions with different periods drawn on the same graph.
Harmonic addition of those three individual functions:
gnuplot> plot f(x)=sin(x*b)+sin(x*0.5*b)+sin(x*0.25*b),b=1,f(x)
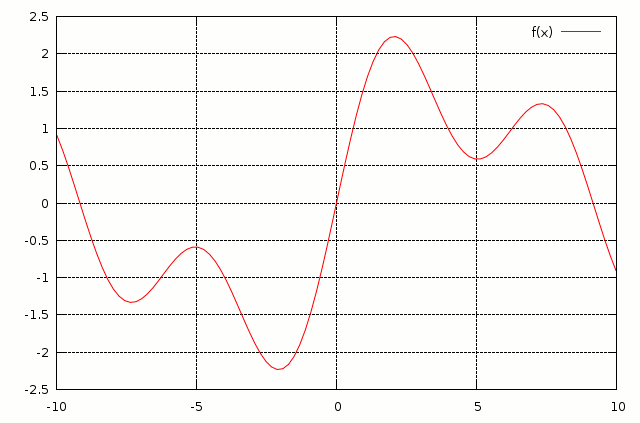
Harmonic addition of three functions.
Range of display and tick increments
To ensure that only certain horizontal range is shown, enter range before function:
gnuplot> plot [-20:20] sin(x)+cos(x)+tan(x)
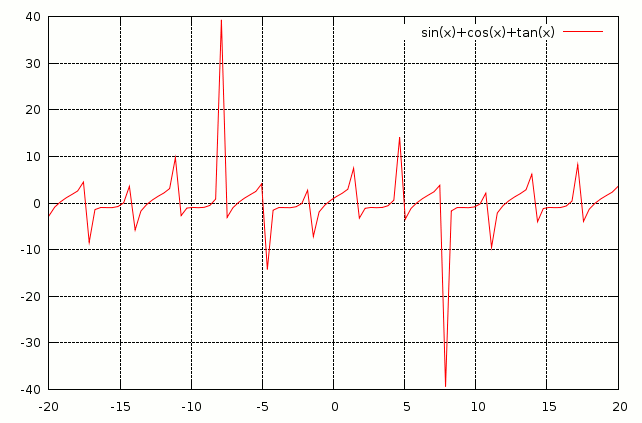
Only given horizontal range (-20:20) of function is plotted.
To set particular number increments for x and y axis:
gnuplot> set xtics pi
gnuplot> set ytics 5

Then:
gnuplot> plot [-2*pi:2*pi] (sin(x)+cos(x))*tan(x)
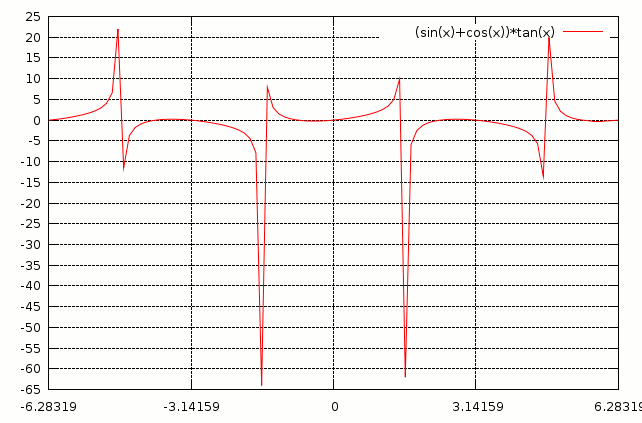
How to specify particular increments for x and y axis.
3D (three dimensional) plots
Now for 3D (three-dimensional) plot with set x and y ranges and tics:
gnuplot> set xtics 0.5

gnuplot> set ytics 0.5
gnuplot> splot [x=-5:5] [y=-5:5] sin(x) * cos(y)
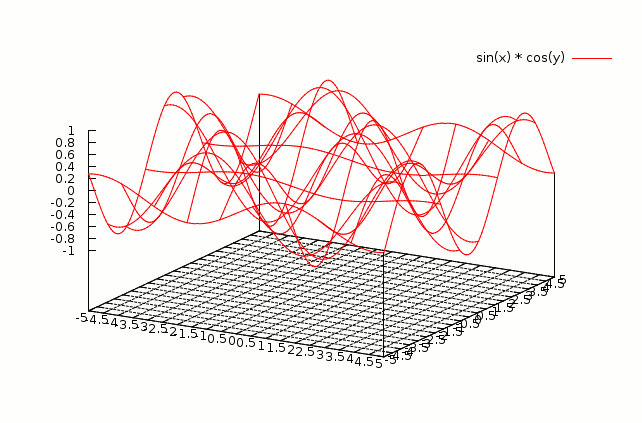
Basic 3D plot.
Filled up color plot:
gnuplot> set xlabel "X"
gnuplot> set ylabel "Y"
gnuplot> set zlabel "Z"
gnuplot> set xtics 0.5
gnuplot> set ytics 0.5
gnuplot> set ztics 0.5
gnuplot> set pm3d
gnuplot> set hidden3d
gnuplot> splot [x=-3:3] [y=-3:3] sin(x) * (0.3*tan(y))
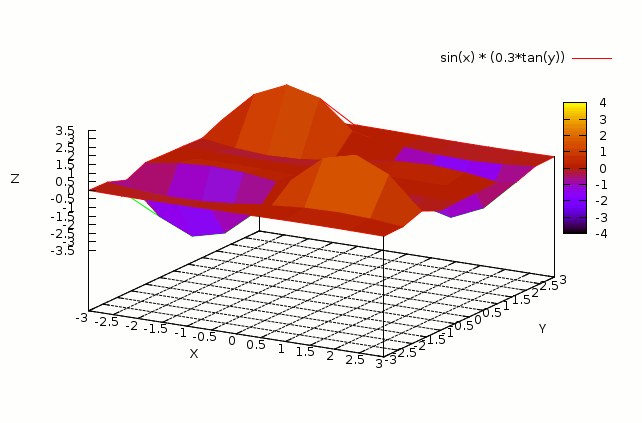
This gives 3D colour plot.
Plotting data from text files
Plotting data from files using Gnuplot:
gnuplot> plot "testdata1.tsv" using 1:2
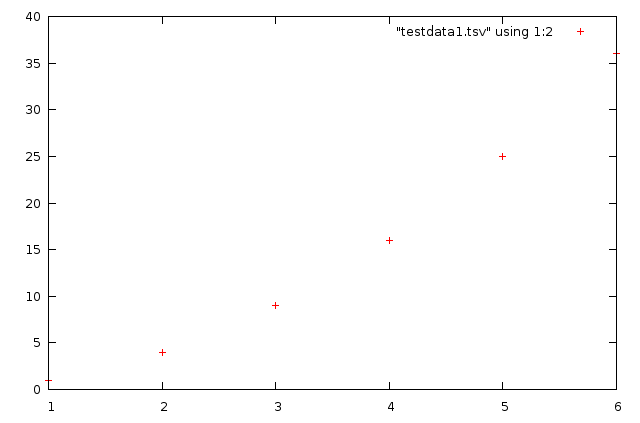
This will only work if you have already prepared a human readable text file with values.
Here is one to get
you started.
It is using tab delimeters for data, and line with # at the beginning is ignored.
Useful links
Collection of excellent examples at http://gnuplot.sourceforge.net/demo/
Back to homepage


